Viewing of geophysical data in the web-browser
Do you ever interested in what is happening at the bottom surface? Would you like to have a look at the unfathomed deeps of seas and oceans?
Today we would like to tell you about the project in the development of which participated our company. This project is the development of the application which receives already ready pictures of a surface of a bottom.
And what tasks we should solve in the process of the development of this application?
We were faced with the task to give the user an opportunity to share the results of its work with other users.
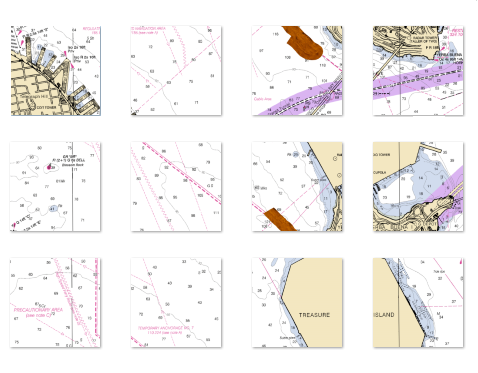
For more detailed researching of technical details we have found out what isn't always possible to display by one picture that the user wants. Because of the limits of the system the very big pictures during the processing had to be divided into several parts. Consequently, to show the whole picture it was necessary to collect the picture of the parts. Each this piece has the size more than 2000 pixels.
Also we need to highlight certain elements of the picture and particularly Canvas allows to draw on it. It has also caused why we have chosen Canvas as an element for work with plan view.
The next task that we were faced was tracking of a cursor position of the user on one of the pictures and to show its situation to another.
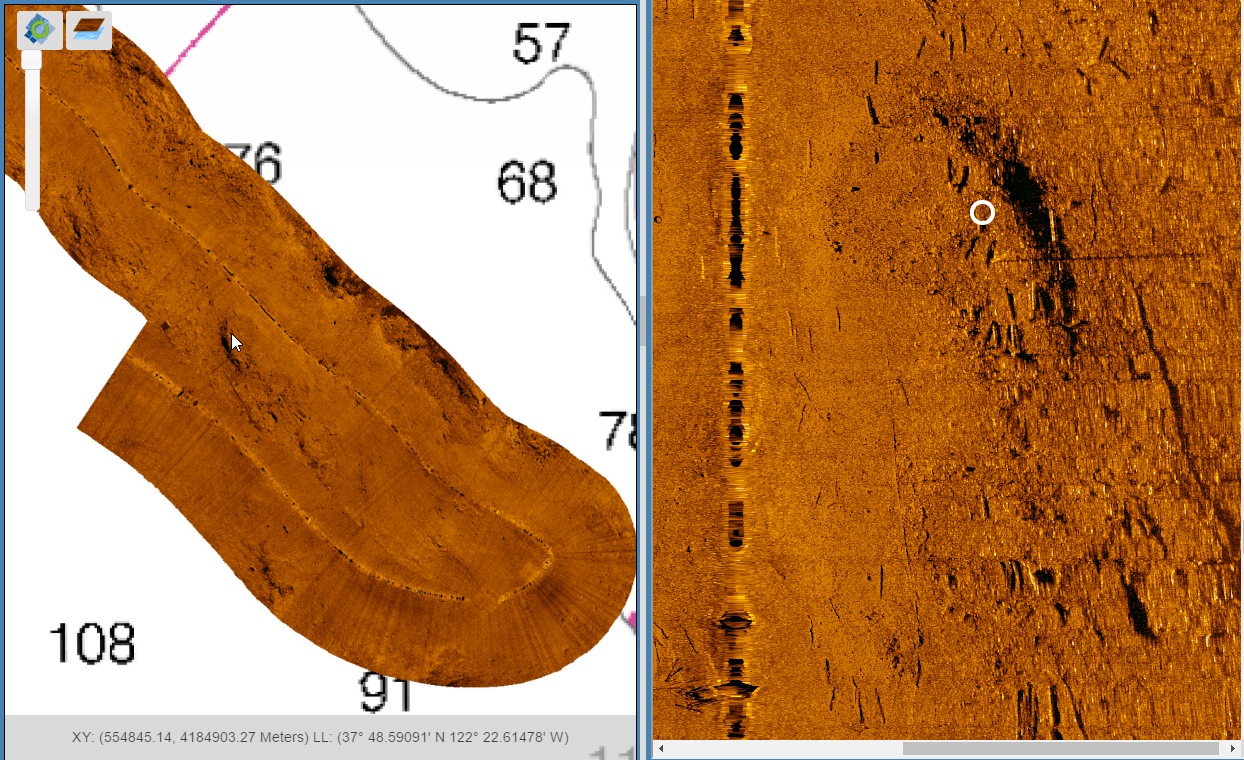
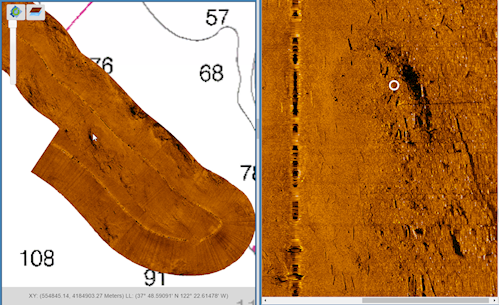
What difficulties we were faced with? Firstly, the position indication. Both pictures have different size, the picture on plan view usually has a ratio of the sides 4:3 whereas the ratio of waterfall image can strongly vary (the size of one waterfall image can be as 1024*30000, and another 1024*2500).
How we have solved the problem? We counted a cursor position in a binding to gео-coordinates and to find the corresponding coordinates on another picture.
The second problem was the speed of calculations. If for a definition of the cursor on plan view considerable calculations weren't required, then for calculations of a cursor position on waterfall image - considerable resources are required.
What decisions we have come to?
We have decided to crush dynamically the waterfall image on boundingBox.
Also, we made pre-calculations of extreme coordinates of areas and they were stored in memory.
And we have defined in what area is the cursor takes place in several stages. At first, the calculations are eliminated by boundingBox, then elimination of extreme points and also, the calculations of the remained points are made for the definition of an exact position. For all these calculations we used JavaScript.
Conclusion
In this article we described our experience in implementing the application for preparing bathymetry data for web deployment.
And if you have a need for custom software development please contact us: http://jazzros.com/contacts
To enable comments sign up for a Disqus account and enter your Disqus shortname in the Articulate node settings.